How to forecast sales in Excel (and when the spreadsheet stops being enough)
Almost every demand planning practice starts the same way: a sales history, an Excel sheet and someone asking “how much will we sell next quarter?” That’s a legitimate starting point — Excel ships with real forecasting functions, and used well they beat guessing by a mile.
This is an honest tutorial: we’ll build a forecast in Excel three ways, from crude to respectable. And because we build forecasting software for a living, we’ll also show you — with documentation, not opinions — exactly where the spreadsheet’s ceiling is.
Before you start: shape your data
Excel’s forecasting functions need two columns: a timeline with a constant step (days, weeks, months — but consistent) and a value per period. Per Microsoft’s documentation, FORECAST.ETS tolerates up to 30% missing points and adjusts for them, but a ragged timeline is the #1 cause of #N/A headaches.
A: Month        B: Units sold
2024-01         1,240
2024-02         1,180
2024-03         1,420
...             ...
Method 1 — Moving average (the baseline)
The simplest forecast: average the last n periods.
=AVERAGE(B21:B23) ← 3-month moving averageWhen it’s fine: stable demand, no trend, no seasonality. When it isn’t: everywhere else. A moving average always lags trends and flattens seasonal peaks — it predicts December like it predicts February.
Method 2 — FORECAST.LINEAR (adds trend)
Fits a straight line through your history:
=FORECAST.LINEAR(A25, B2:B24, A2:A24)Now a growing product gets a growing forecast. But the line is straight: it still can’t see that your sales spike every December and dip every February.
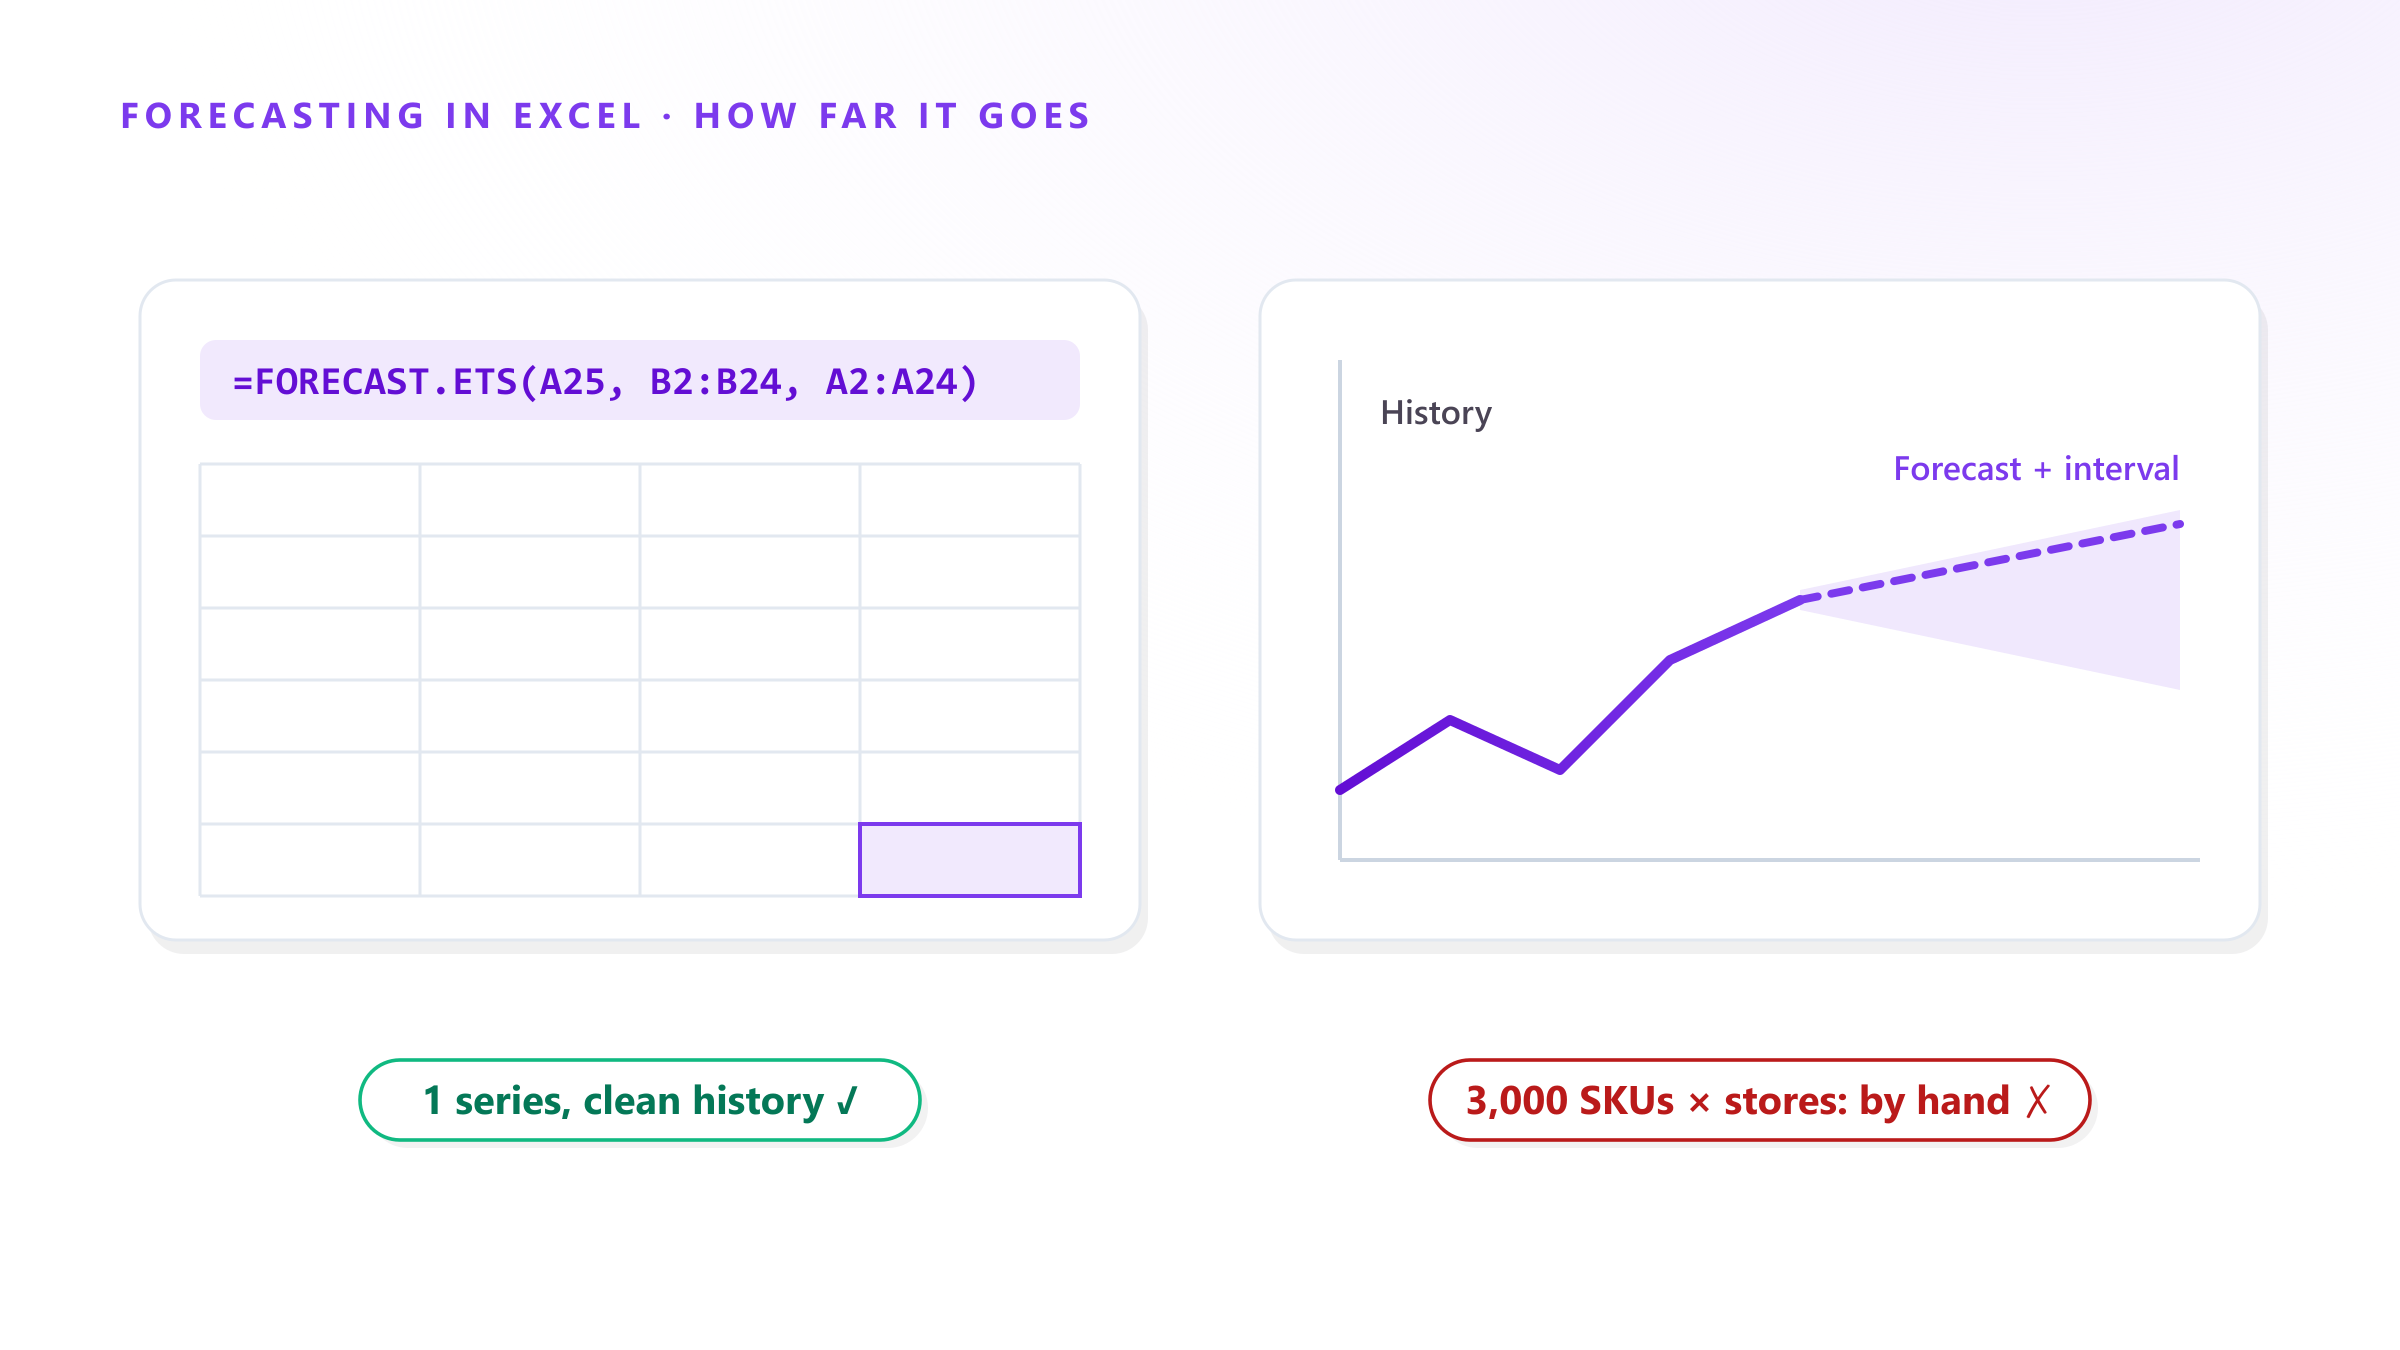
Method 3 — FORECAST.ETS (adds seasonality)
This is the serious one. FORECAST.ETS uses triple exponential smoothing (ETS AAA) — a respected statistical method, the same family covered in Hyndman’s Forecasting: Principles and Practice — and detects seasonality automatically:
=FORECAST.ETS(A25, B2:B24, A2:A24)Three companion functions are worth knowing:
| Function | What it tells you |
|---|---|
FORECAST.ETS.SEASONALITY | the seasonal cycle length Excel detected |
FORECAST.ETS.CONFINT | the confidence interval around each point |
FORECAST.ETS.STAT | the model’s internal parameters and errors |
Even faster: select your two columns and hit Data → Forecast Sheet (Microsoft’s guide) — Excel builds the chart, the forecast and the confidence band in one click.
Whichever method you use, measure the error: hold out the last few months, forecast them, and compare with WMAPE and bias. A forecast you don’t measure is an opinion.
Where the ceiling is — documented, not opinion
Everything above works, and for one product with two-plus years of clean monthly history it works well. The limits are structural, and they’re in the documentation:
- One series at a time. Each formula forecasts one column. 3,000 SKUs × 10 locations = 30,000 hand-maintained forecast formulas. There is no global model — no learning transferred from one product to another.
- No external variables. FORECAST.ETS accepts a timeline and values, period. Weather, prices, promotions, holidays — the signals that won the M5 competition — have no input slot.
- Short histories fall back to a straight line. With fewer than ~2 seasonal cycles of data, Excel can’t detect seasonality and quietly reverts to a linear trend. New products get the dumbest forecast.
- Manual refresh, manual risk. Every new month means re-extending ranges by hand. And spreadsheet audits compiled by Panko find errors in roughly 90% of operational workbooks — errors that no one sees until they’ve already become a purchase order.
- Single seasonality. Demand with weekly and yearly patterns (most retail) exceeds what the AAA model can represent.
And the accuracy gap is measured: in the M5 competition, on 42,840 real Walmart series, every one of the top 50 methods was Machine Learning — the winner beat the best classical statistical benchmark by 22.4%.
The honest verdict
| Excel (ETS) | ML software | |
|---|---|---|
| One product, clean history | ✅ respectable | ✅ |
| Hundreds–thousands of SKUs | ❌ manual | ✅ automatic, one model |
| Promotions, weather, prices | ❌ no input | ✅ unlimited exogenous variables |
| New products (short history) | ❌ linear fallback | ✅ learns from similar SKUs |
| Daily refresh | ❌ by hand | ✅ nightly, automatic |
If you’re forecasting one product line for the board, learn FORECAST.ETS and you’re well served. If you’re planning a catalog — purchasing, inventory and budgets across hundreds of SKUs — the spreadsheet isn’t failing because your team is careless; it’s failing because the tool was never built for that. That’s the moment to look at what specialized software does differently.
Forecast Studio picks up exactly where the sheet stops: one Machine Learning model for thousands of SKUs, unlimited exogenous variables, retrained nightly, up to 95% accuracy — no code and no data scientist. Book a free demo and bring your messiest Excel file; we’ll show you the difference on your own data.
Sources: Microsoft, FORECAST.ETS function · Microsoft, Create a forecast in Excel · Hyndman & Athanasopoulos, Forecasting: Principles and Practice — exponential smoothing · Makridakis et al., M5 accuracy competition, IJF · Panko, Spreadsheet Errors: What We Know