What is demand planning and why Machine Learning beats Excel
Every year, retail loses around $1.7 trillion to what analysts call inventory distortion: shelves that run empty while warehouses fill up with products nobody buys, according to IHL Group. Behind most of that money sits the same root cause: demand forecasts that miss.
Demand planning is the process of estimating how much your company will sell in the future so you can make better decisions about inventory, purchasing, production and finance. Done well, it prevents stockouts, reduces excess inventory and protects your budgets.
In this article you’ll learn what it is, what the evidence says about Machine Learning versus manual methods, and why more and more companies are replacing Excel with specialized software like Forecast Studio.
What demand planning is
Planning demand means turning your sales history —along with external variables such as weather, prices and promotions— into an actionable forecast for each product (SKU), channel or location.
Good demand planning answers three questions:
- How much will we sell? By SKU, business line and period.
- How much inventory should we hold? Safety stock and reorder point.
- How much should we buy or produce, and when?
It’s not a one-off spreadsheet exercise either. Mature teams run it as a monthly cycle: clean the sales history, build a statistical baseline forecast, enrich it with input from sales and marketing, and feed the result into S&OP and inventory policies. Then they measure how accurate the forecast was and adjust.
Why Excel falls short
Spreadsheets were the standard for decades, and the research on them is brutal. Audits compiled by Raymond Panko (University of Hawaii) consistently find that around 90% of operational spreadsheets contain errors — humans make mistakes in roughly 1–5% of cells, and in a workbook with thousands of formulas those mistakes compound silently. The consequences aren’t theoretical: JPMorgan’s 2012 “London Whale” episode — over $6 billion in losses — involved a risk model run on Excel with manual copy-paste, one of many cases catalogued by EuSpRIG.
For forecasting specifically, the limits are clear:
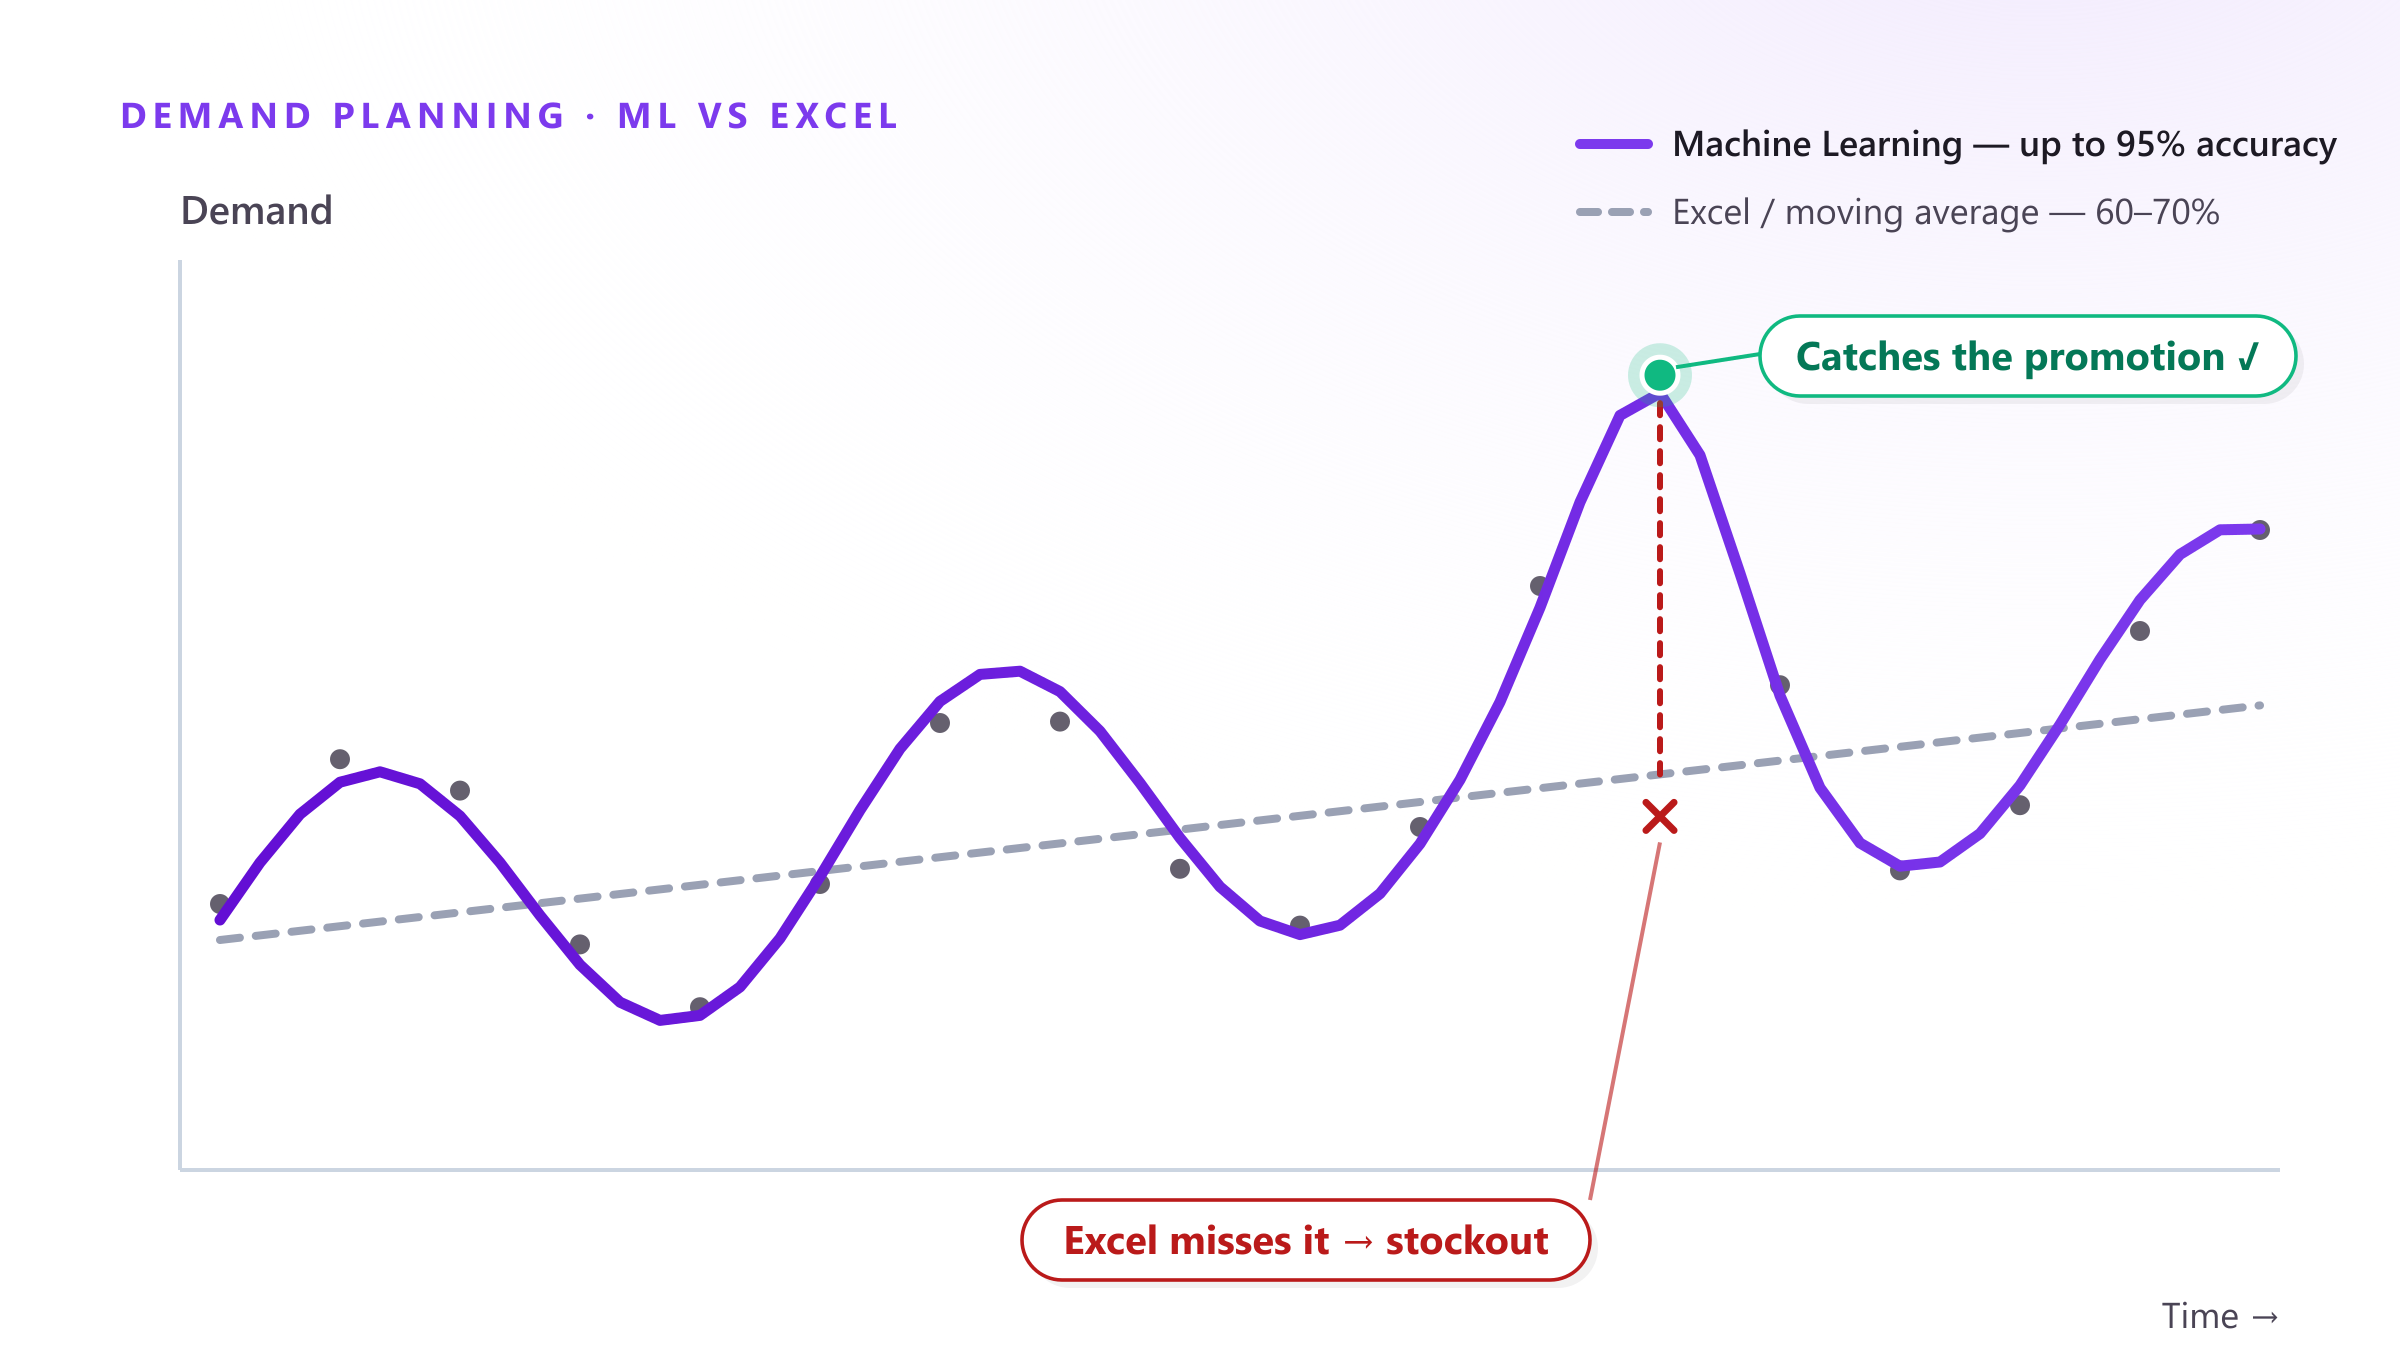
- Low accuracy: manual methods land around 60-70%.
- They don’t scale: thousands of SKUs × locations × weeks means millions of cells maintained by hand.
- No Machine Learning: a moving average can’t separate seasonality, trend and promotion effects automatically.
- Error-prone and opaque: a broken formula can go unnoticed for months, with no audit trail.
If your team spends days updating Excel files and you still get stockouts, the problem isn’t your team: it’s the tool.
The evidence: ML forecasts beat traditional methods
This isn’t a vendor claim anymore — it’s been measured in the open. The M5 competition (Makridakis et al.), the largest public forecasting benchmark, had thousands of teams predict real Walmart sales across 42,840 series. For the first time, every top-performing method was pure Machine Learning: all of the top 50 used ML, and the winner was 22.4% more accurate than the best classical statistical benchmark.
In business terms, McKinsey estimates that AI-driven forecasting reduces supply chain forecast errors by 20–50%, cuts lost sales from product unavailability by up to 65%, and lowers warehousing costs by 5–10% and administrative costs by 25–40%.

Why Machine Learning wins
A Machine Learning model learns from your history and from exogenous variables to predict demand more accurately. The advantages are structural, not incremental:
- It learns across your whole catalog: global models transfer patterns between similar products, so even SKUs with short histories get usable forecasts.
- Unlimited exogenous variables: weather, prices, promotions and calendar events — exactly the signals that won M5.
- Automatic seasonality and trend detection, per SKU, with no formulas to maintain.
- It retrains continuously: Forecast Studio processes your data nightly, so every morning starts with fresh forecasts — up to 95% accuracy, across thousands of SKUs, with no code and no data scientist required.
One caveat worth being honest about: an improvement only counts if you measure it. Before and after any change of tool, track your error with metrics like WAPE or MAPE — we explain how in our guide to forecast accuracy metrics.
Excel vs specialized software, side by side
| Excel / manual | ML software | |
|---|---|---|
| Typical accuracy | 60–70% | up to 95% |
| SKUs handled | dozens, by hand | thousands, automatically |
| External variables | manual at best | unlimited, built-in |
| Seasonality & trend | manual formulas | detected automatically |
| Update cycle | hours or days per refresh | nightly, automatic |
| Error risk | ~90% of sheets contain errors | validated, auditable pipeline |
When it makes sense to switch
Consider making the jump if:
- You manage hundreds or thousands of SKUs.
- You face recurring stockouts or overstock.
- Your budgets drift too far from reality.
- Your team loses hours maintaining spreadsheets.
Conclusion
Demand planning with Machine Learning isn’t a luxury reserved for large enterprises: with a personalized quote model, it’s also affordable for SMBs. The result is less uncertainty, lower logistics costs and safer financial decisions across every area of your operation.
Want to see it with your own data? Book a free demo and we’ll show you Forecast Studio in action in 30 minutes.
Sources: IHL Group — inventory distortion study · Panko, Spreadsheet Errors: What We Know · EuSpRIG horror stories · Makridakis et al., M5 accuracy competition, IJF · McKinsey, AI-driven operations forecasting