Forecast accuracy metrics that actually matter: MAPE, WMAPE and bias
You cannot improve a forecast you do not measure. But the metric you pick shapes the behavior you get — so it pays to understand what each one rewards before you put it on a dashboard.
MAPE: simple, but easy to mislead with
MAPE (Mean Absolute Percentage Error) averages the percentage error across all items:
MAPE = average of ( |actual − forecast| ÷ actual )
It is intuitive and unit-free, which is why it is everywhere. But it has two well-documented flaws. First, it treats every SKU equally, so a tiny, erratic product can wreck the number while your top revenue line looks fine. Second, as Hyndman and Koehler showed in the standard reference on accuracy measures, it blows up when actual demand is near zero — and is infinite or undefined when demand is zero, which intermittent products hit all the time.
There is a subtler trap too: MAPE caps at 100% when you under-forecast (a forecast of zero is “only” 100% off) but is unbounded when you over-forecast. Put it on a bonus plan and you have quietly told everyone to forecast low.
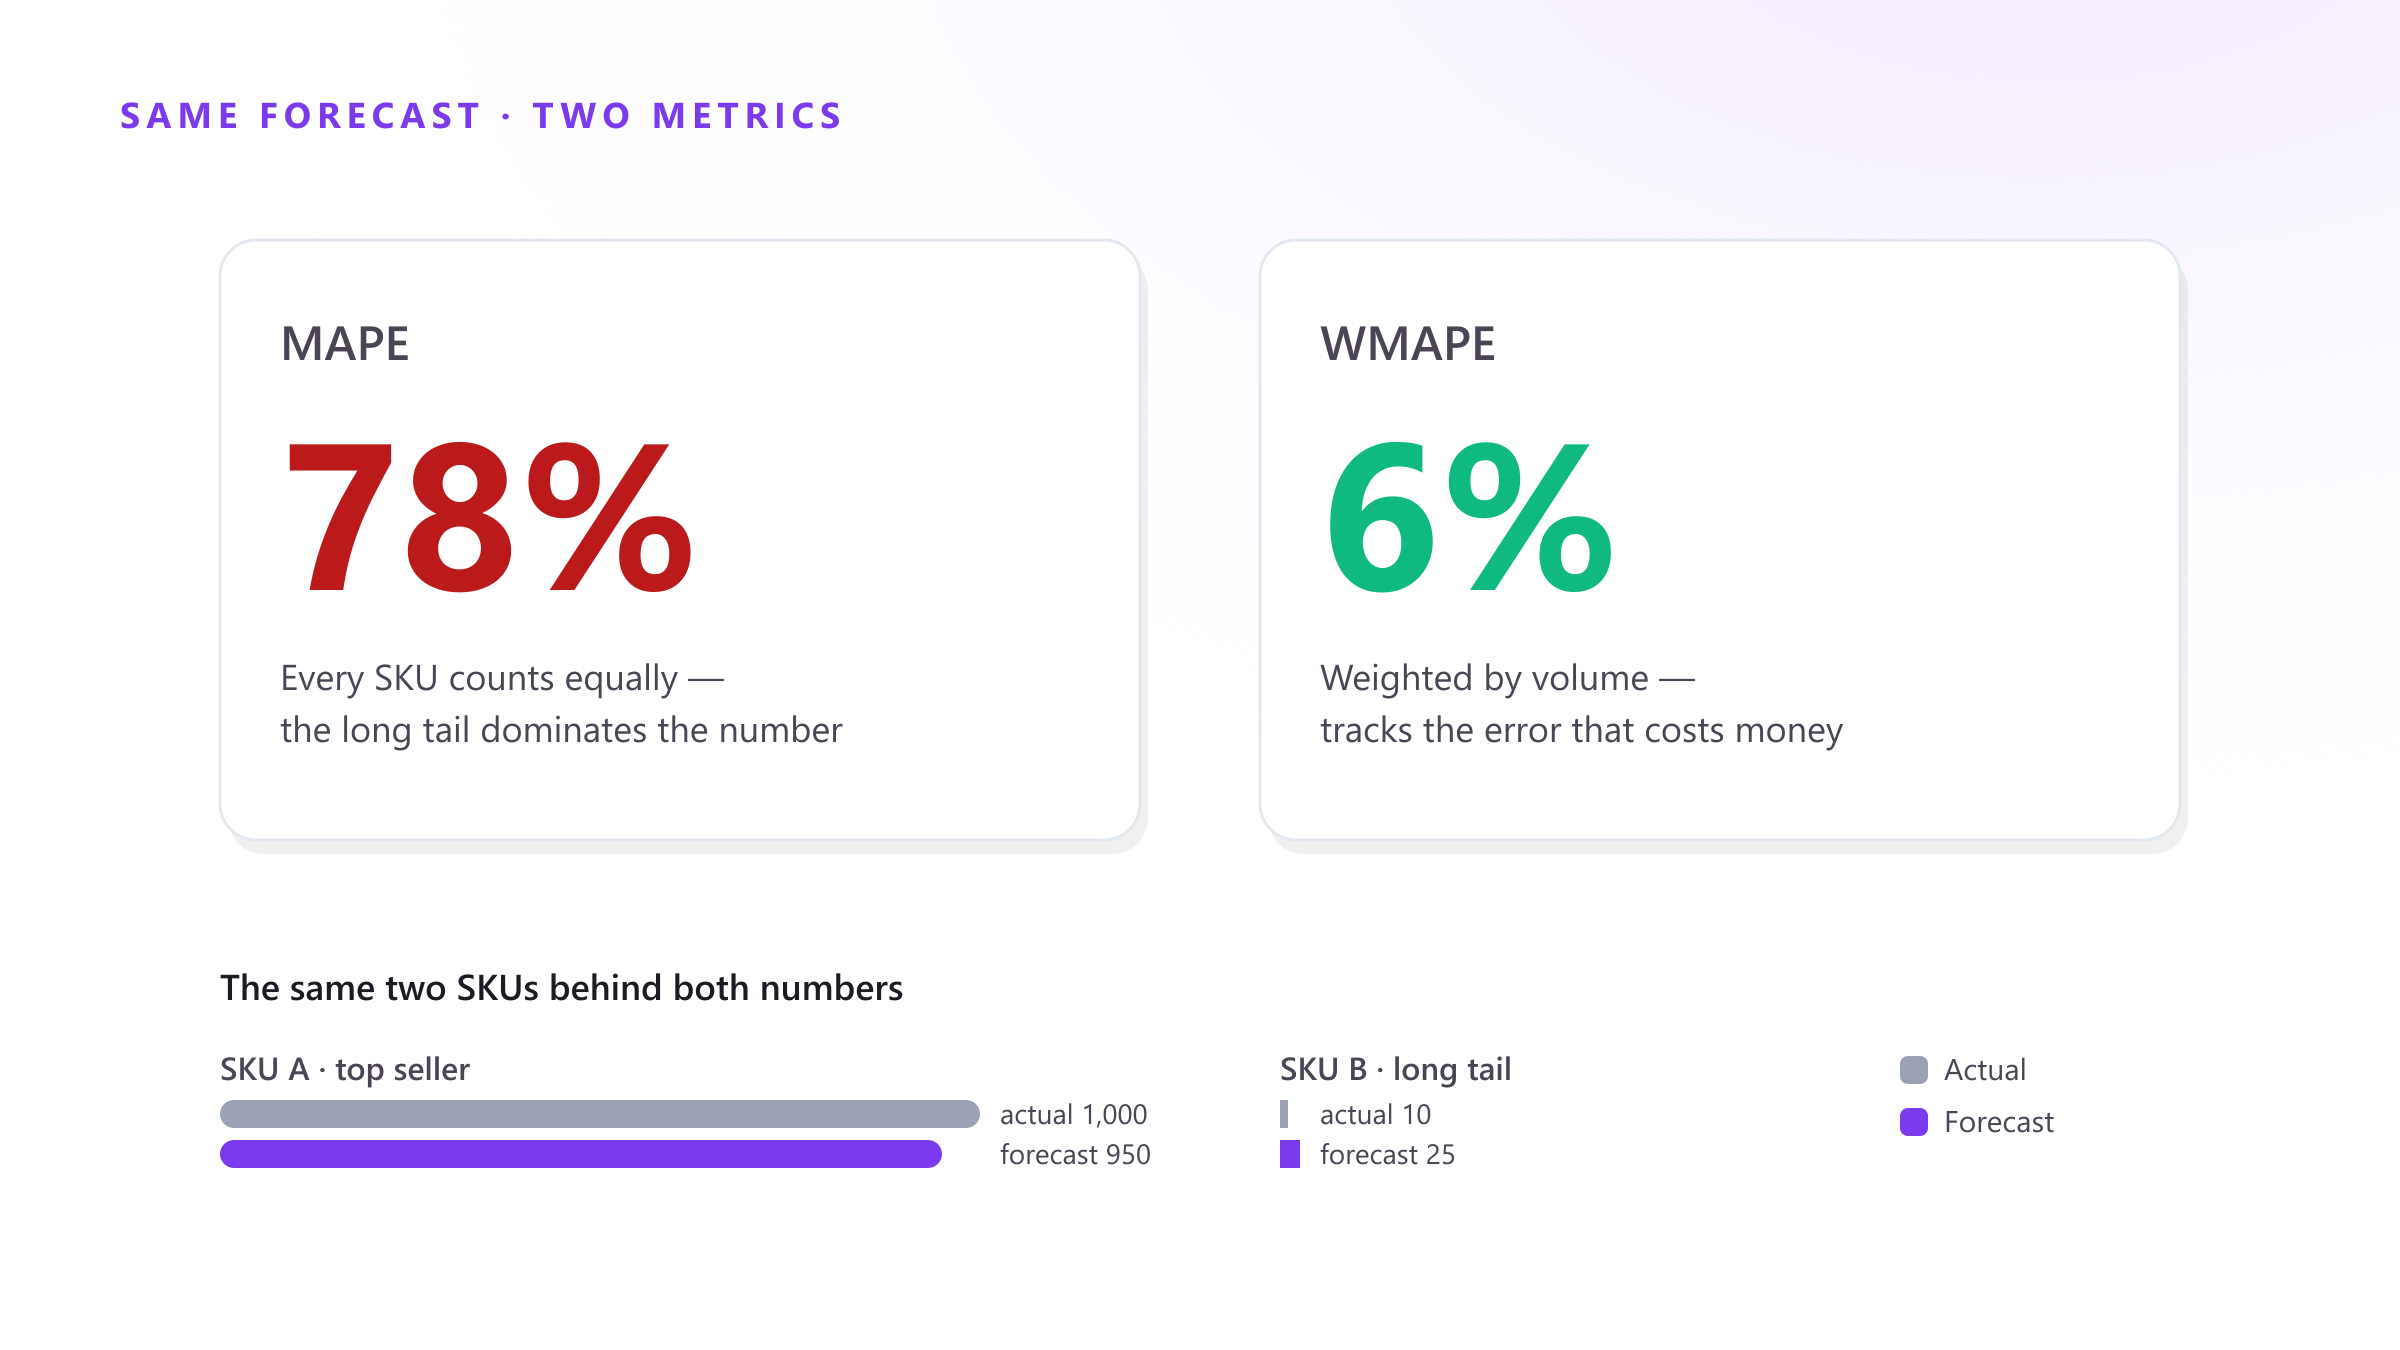
WMAPE: weight by what matters
WMAPE (Weighted MAPE) fixes the equal-weighting problem by weighting each error by volume — usually units or revenue:
WMAPE = sum of |actual − forecast| ÷ sum of actuals
Watch what that does to a catalog. Take just two SKUs:
| SKU A (top seller) | SKU B (long tail) | |
|---|---|---|
| Actual | 1,000 | 10 |
| Forecast | 950 | 25 |
| Absolute error | 50 | 15 |
| Percentage error | 5% | 150% |
- MAPE = (5% + 150%) ÷ 2 = 77.5% — looks like a disaster.
- WMAPE = (50 + 15) ÷ 1,010 = 6.4% — the honest picture.
Same data, opposite stories. Big sellers move WMAPE; long-tail noise does not. For most planning teams it is the more honest headline number because it tracks the error that actually costs money — and when a vendor (us included) talks about “forecast accuracy”, that figure is typically 1 − WMAPE. It is no accident that serious benchmarks like the M5 competition scored entries with volume-weighted, scaled error measures rather than plain MAPE.
Bias: the metric teams forget
Accuracy tells you how far off you are; bias tells you which direction:
Bias = ( sum of forecasts − sum of actuals ) ÷ sum of actuals
A forecast can have decent accuracy while consistently running 10% high — and persistent bias is far more damaging than random error, because it does not cancel out: it compounds, month after month, into excess inventory or chronic stockouts. Random error is what your safety stock exists to absorb; bias defeats the buffer entirely, because the buffer math assumes the error is centered on zero.
Track accuracy and bias together. Low error with near-zero bias is the goal.
FVA: is each step of your process earning its keep?
One more measurement habit separates mature teams from the rest: Forecast Value Added (FVA), popularized by Michael Gilliland at SAS. The idea: compare every step of your process — statistical model, planner overrides, management review — against a naive forecast (e.g., “next month = last month”). Each step should beat the one before it; any step that doesn’t is costing you effort and accuracy.
The published results are humbling. In the whitepaper’s Newell Rubbermaid case, the statistical forecast added five points of accuracy over naive — and the management review step subtracted value. Many executive “adjustments” turn out to be exactly that. You will never know until you measure the touches, not just the final number.
Make it actionable
- Measure at the level you decide on — usually SKU × location × week. A great aggregate number can hide offsetting disasters underneath.
- Review the worst contributors, not just the average. A good metric points to the handful of items where a better demand plan would free the most cash and service.
- Trend the bias, per planner and per segment. Persistent sign = systematic problem (or a sandbagged target), not bad luck.
- Make the scoreboard part of your S&OP cycle: the demand review should open with last cycle’s WMAPE and bias, or the meeting drifts back to opinions.
Conclusion
Pick WMAPE as the headline, keep bias next to it, and run FVA once a quarter to keep the process honest. None of this requires exotic math — it requires the discipline of measuring, which is exactly what a nightly forecasting engine like Forecast Studio automates: per-SKU accuracy and bias, recomputed every morning, with no spreadsheet surgery.
Want to know your real WMAPE? Book a free demo and we’ll measure it on your own data in 30 minutes.
Sources: Hyndman & Koehler, Another look at measures of forecast accuracy, IJF 2006 · Hyndman & Athanasopoulos, Forecasting: Principles and Practice · Gilliland, Forecast Value Added Analysis: Step by Step, SAS · Makridakis et al., M5 accuracy competition, IJF