Prediction intervals in forecasting: quantifying uncertainty beyond the point forecast
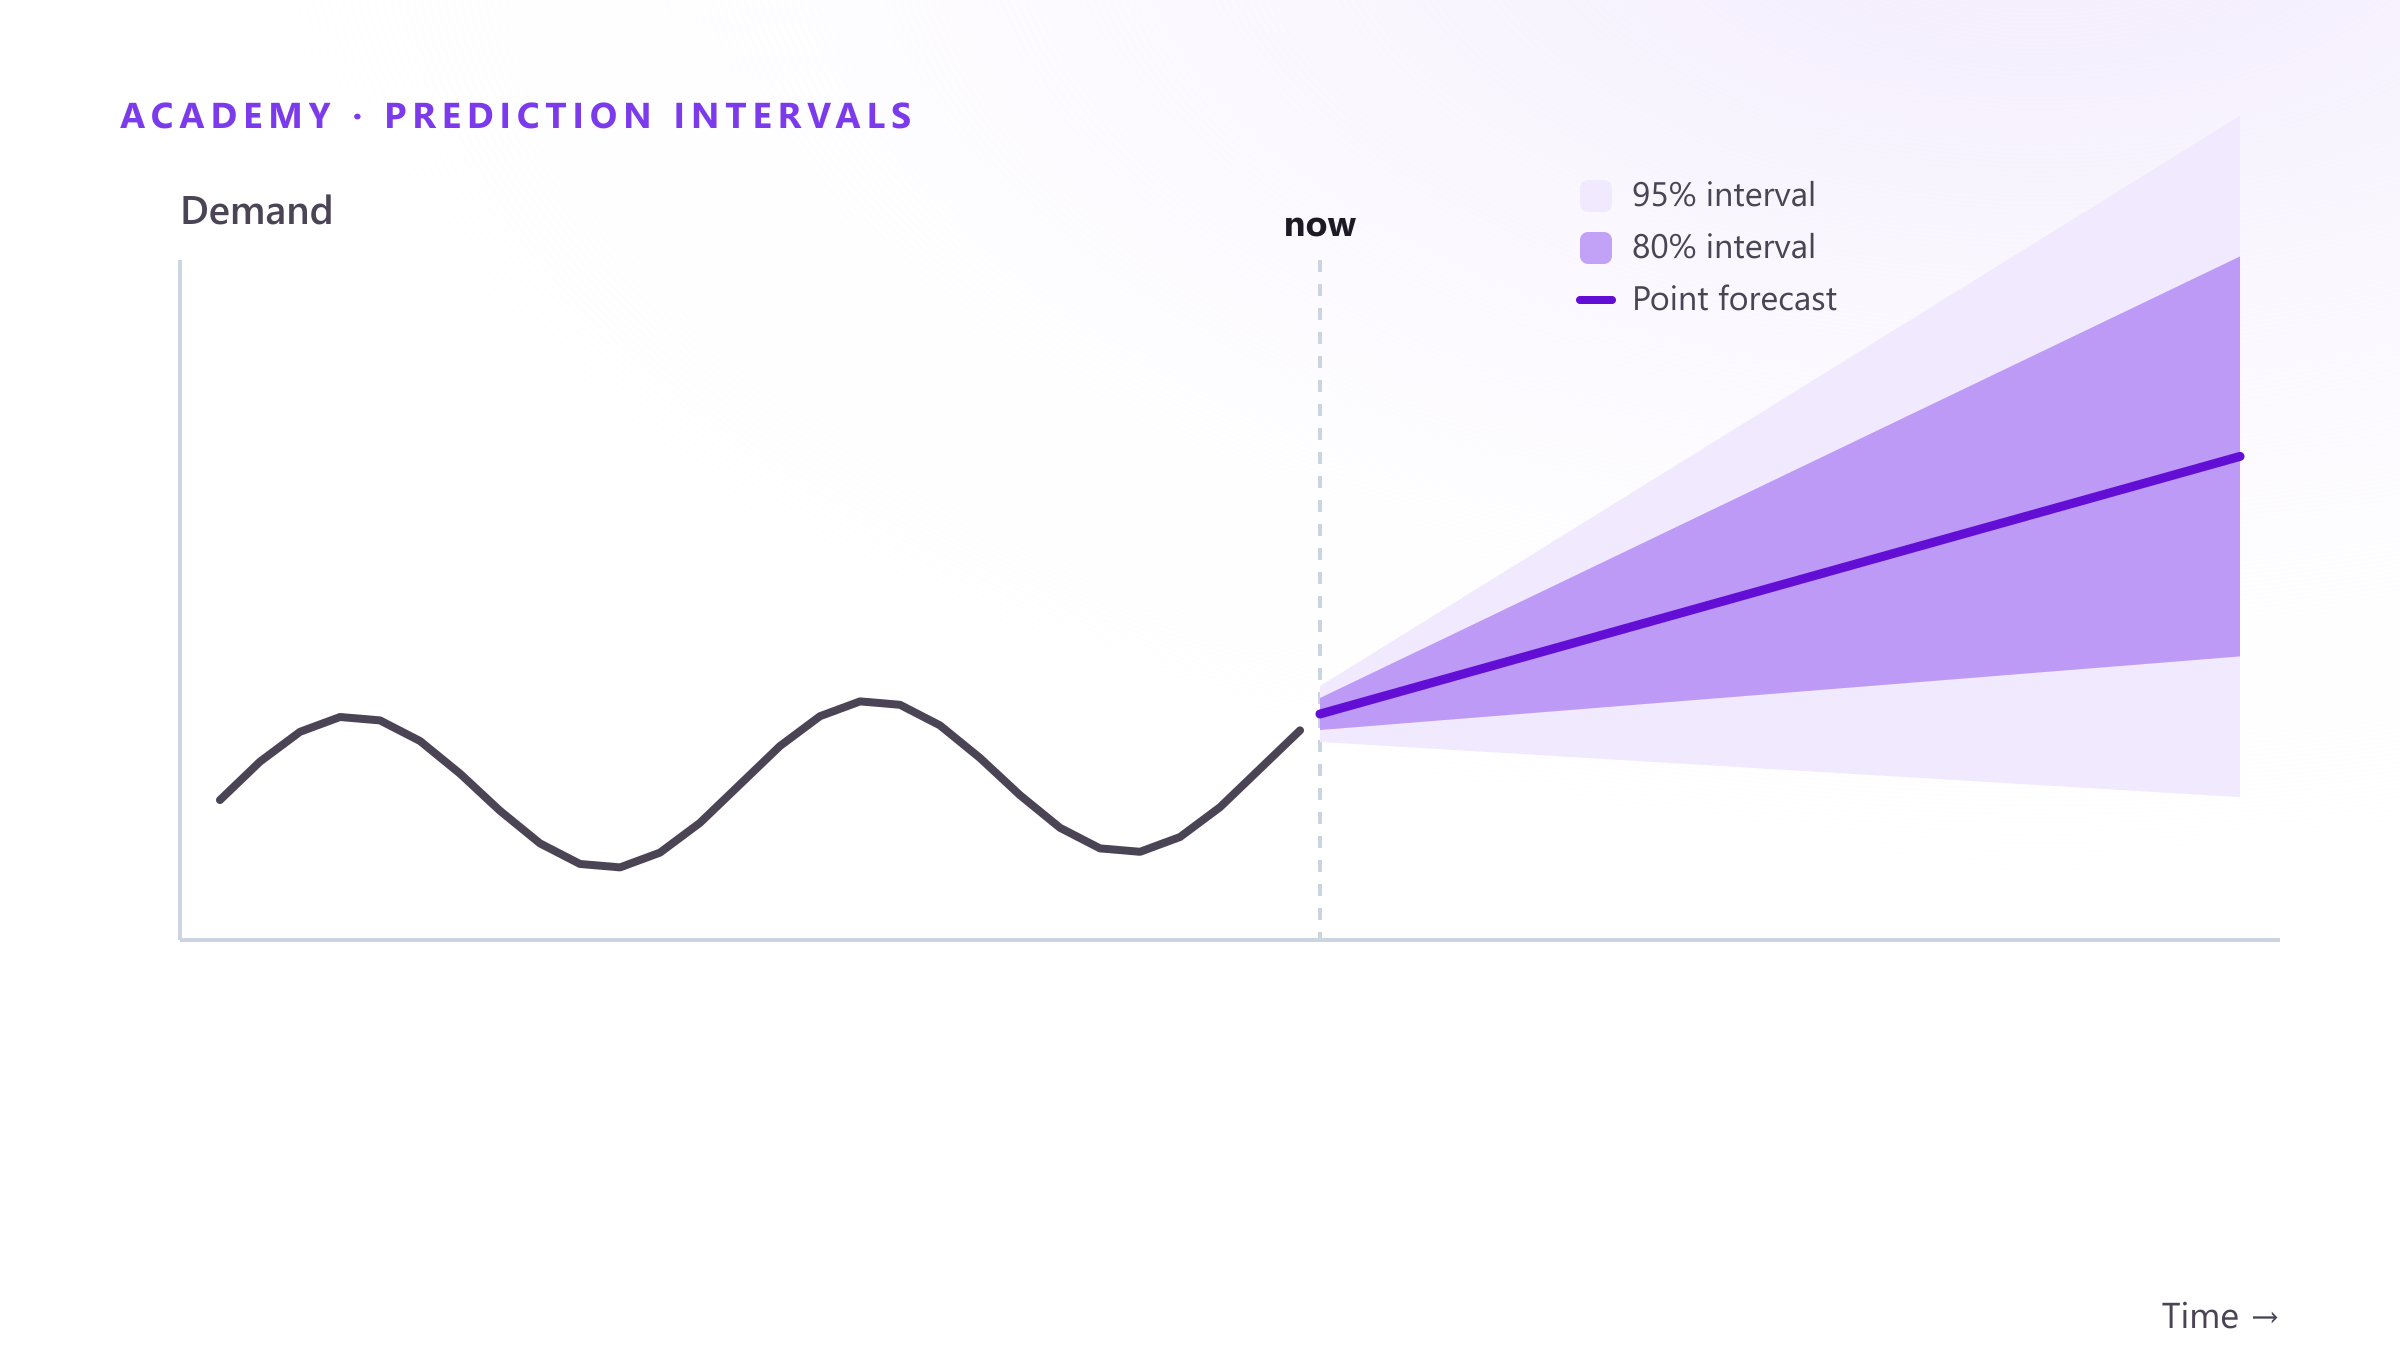
A point forecast answers “what will demand be.” A prediction interval answers the more useful question: “what range should I plan for, and how confident am I.” A single number is always wrong by some margin; an interval quantifies that margin, and every forecast that omits one is hiding information the reader needs to size a buffer (FPP3 §5.4).
What an interval means
An 80% prediction interval is constructed so that, on average, the actual value falls inside it 80% of the time. It is not a claim of certainty — it is a calibrated statement about how often the model is wrong by how much, given its residual history. Chatfield (1993) reviews decades of evidence that published intervals are routinely too narrow because they only capture parameter uncertainty and ignore model-selection uncertainty — a caution worth keeping in mind before trusting any interval blindly, including a well-fit one.
How ETS and ARIMA compute them
Because ETS and ARIMA are proper statistical models with an explicit error distribution, both derive intervals analytically from the model’s estimated variance, widening with the forecast horizon under a Gaussian error assumption (FPP3 §8.7, §9.8). This is fast and exact when the Gaussian assumption holds.
When it doesn’t: bootstrapping
Retail demand is rarely Gaussian — it’s often skewed, has fat tails from promotions, or is intermittent with a mass of zeros. In those cases, bootstrapping the residuals (resampling them and simulating many alternative future paths) produces an empirical interval that doesn’t assume a distribution shape, at the cost of more compute (FPP3 §5.5).
Evaluating interval quality, not just the point forecast
An interval is a probabilistic forecast, so it needs its own metrics, not just MAE/RMSE on the median:
- Coverage — does the actual fall inside the interval close to the nominal rate (e.g. ~80% of the time for an 80% interval), out of sample?
- Pinball loss (quantile loss) — scores each quantile forecast by how well-calibrated it is, rewarding narrow-but-correct intervals over wide-but-safe ones (Gneiting & Raftery, 2007).
A model that’s well calibrated but has intervals twice as wide as a competitor is strictly worse for planning — width matters as much as coverage.
Checklist
- Never ship a point forecast alone for a decision that involves a buffer (safety stock, capacity, staffing) — report the interval.
- Check coverage out of sample; a nominal 80% interval that only covers 60% of actuals is miscalibrated, not just “unlucky”.
- Use bootstrapped intervals for skewed, intermittent or promotion-heavy series instead of trusting a Gaussian assumption by default.
- Narrower well-calibrated intervals are the real payoff of a better model — they translate directly into smaller safety-stock buffers without added stockout risk.
Forecast Studio reports the error distribution behind every trained model, not just a single accuracy number, so intervals reflect what the model actually got wrong historically — reproducible on the Free plan’s public tenant.
Sources: Hyndman & Athanasopoulos, FPP3 §5.4–5.5, §8.7, §9.8 · Chatfield (1993), Journal of Business & Economic Statistics · Gneiting & Raftery (2007), JASA