The reorder point (ROP): the formula that tells you exactly when to buy
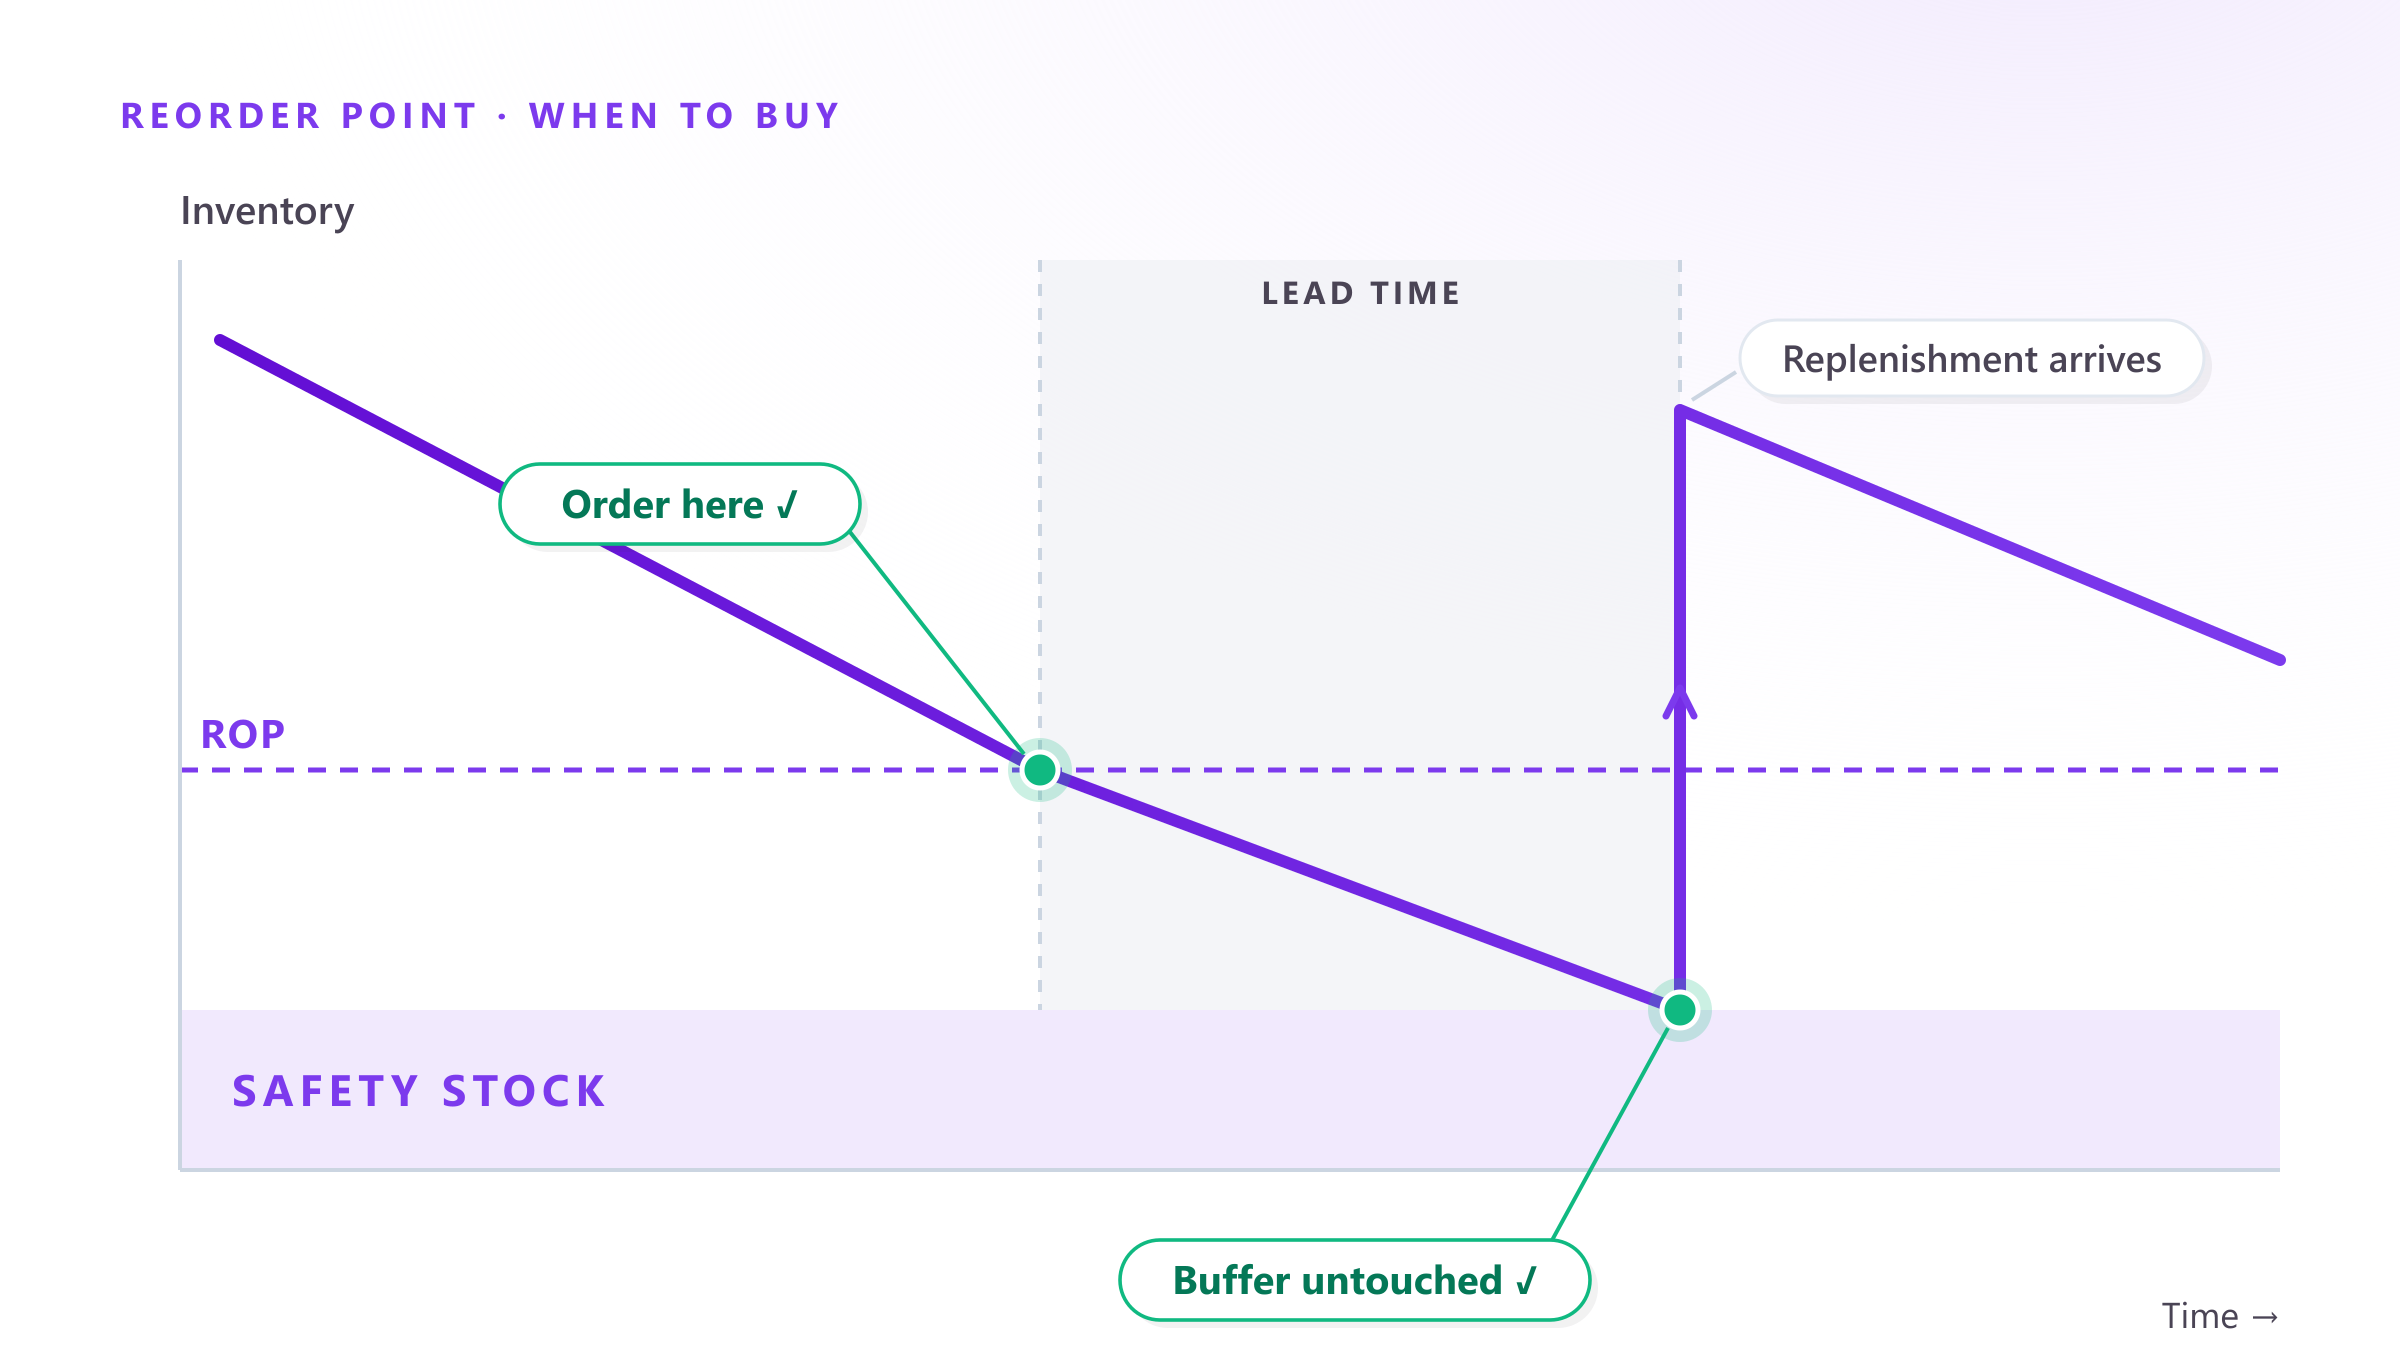
Every buyer faces the same two-sided risk: order too late and the shelf runs empty — stock-outs cause walkouts, as Corsten and Gruen documented in HBR, with roughly half of shoppers simply buying elsewhere — or order too early and cash sits frozen in the warehouse. The reorder point (ROP) is the inventory level that resolves that tension: when stock touches it, you place the order, and the replenishment arrives just before you’d need to dip into your buffer.
It’s one of the simplest formulas in supply chain — and one of the easiest to get silently wrong. Here’s how to calculate it, a worked example, and the fine print nobody reads until a stockout reads it for them.
The formula
According to the standard definition (NetSuite has a good reference):
ROP = (average daily demand × lead time in days) + safety stockTwo ingredients plus a cushion:
- Demand during lead time — what you expect to sell between placing the order and receiving it. If you sell 40 units a day and your supplier takes 6 days, you’ll consume 240 units while you wait.
- Safety stock — the buffer that absorbs demand spikes and late deliveries. Sized from demand variability and your target service level (we covered the formulas, including King’s lead-time-variability version, in the safety stock guide).
Worked example
A distributor sells a SKU at an average of 40 units/day. The supplier’s lead time is 6 days. Safety stock, sized for a 95% service level against demand variability, is 96 units.
| Component | Value |
|---|---|
| Average daily demand | 40 units |
| Lead time | 6 days |
| Demand during lead time | 40 × 6 = 240 units |
| Safety stock | 96 units |
| Reorder point | 240 + 96 = 336 units |
When inventory hits 336 units, the purchase order goes out. Over the next 6 days you expect to sell 240, landing at 96 — the safety stock — exactly when the truck arrives. The buffer never gets touched unless something deviates from plan: a demand spike, a late delivery. That’s what it’s for.
The fine print: every input is a forecast
Notice what the formula quietly assumes:
- “Average daily demand” is a forecast. Use last year’s average for a product that’s growing 20%, and your ROP is obsolete the day you set it.
- Lead time isn’t constant. Suppliers slip. If lead time varies a lot, it belongs inside the safety stock calculation, not just the multiplication.
- One ROP per SKU per location. A product that turns fast in one warehouse and slow in another needs two different reorder points.
Where the static ROP breaks
The textbook formula works when demand is stable. Most demand isn’t. The retail forecasting research compiled by Fildes, Ma and Kolassa shows demand at SKU level is shaped by seasonality, promotions, price changes and calendar events — exactly the things a single annual average erases.
Concretely, a fixed ROP fails in three familiar ways:
- Seasonality: an ROP set on the yearly average under-orders before the high season and over-orders after it.
- Promotions: demand during lead time can double — the order that “should” have covered 6 days covers 3.
- Trend: for a growing product, every month the ROP triggers later than it should.
The result is the worst of both worlds: stockouts on your best SKUs in the peak, excess on the rest. The fix is not to abandon the formula — it’s to feed it a real forecast. Replace the flat “average daily demand” with the forecast demand over the lead-time window, recalculated as the forecast updates, and the ROP becomes dynamic: it rises before the season, absorbs the promotion, follows the trend.
That’s how Forecast Studio handles purchasing: the Machine Learning forecast — up to 95% accuracy, refreshed nightly — drives an automatic reorder point per SKU, so purchase orders are prioritized by what demand will actually be, not what it used to average. McKinsey estimates that AI-driven forecasting cuts errors by 20–50% — and every point of error you remove flows straight into a tighter, more reliable reorder point.
Quick checklist
- Calculate ROP per SKU and per location, not per catalog.
- Recalculate when demand or lead time changes — monthly at minimum.
- Size safety stock from variability and service level, not gut feel.
- Segment first: your A-items deserve tighter ROPs than the long tail.
- Measure forecast error (WMAPE and bias) — a biased forecast poisons every ROP downstream.
Want to see your own SKUs with a dynamic, forecast-driven reorder point? Book a free demo — 30 minutes, your real data, no credit card.
Sources: Corsten & Gruen, Stock-Outs Cause Walkouts, HBR · NetSuite, Reorder Point Defined: Formula & How to Use · King, Crack the Code: Understanding safety stock, APICS Magazine · Fildes, Ma & Kolassa, Retail forecasting: Research and practice, IJF · McKinsey, AI-driven operations forecasting