Demand forecasting in retail: why it's the hardest — and the most profitable to fix
Retail is where forecasting earns its keep or burns the money. IHL Group estimates that inventory distortion — stockouts plus overstocks — costs retail around $1.77 trillion a year worldwide. And the academic review of the field (Fildes, Ma & Kolassa, Retail forecasting: Research and practice) is blunt about why: retail demand is shaped by promotions, prices, weather, events and store-level effects that simple methods systematically miss.
If you run planning for a retailer or a consumer-goods distributor, this post maps the specific reasons your demand is harder than the textbook — and why that’s precisely where better forecasts pay back fastest.
What makes retail demand different
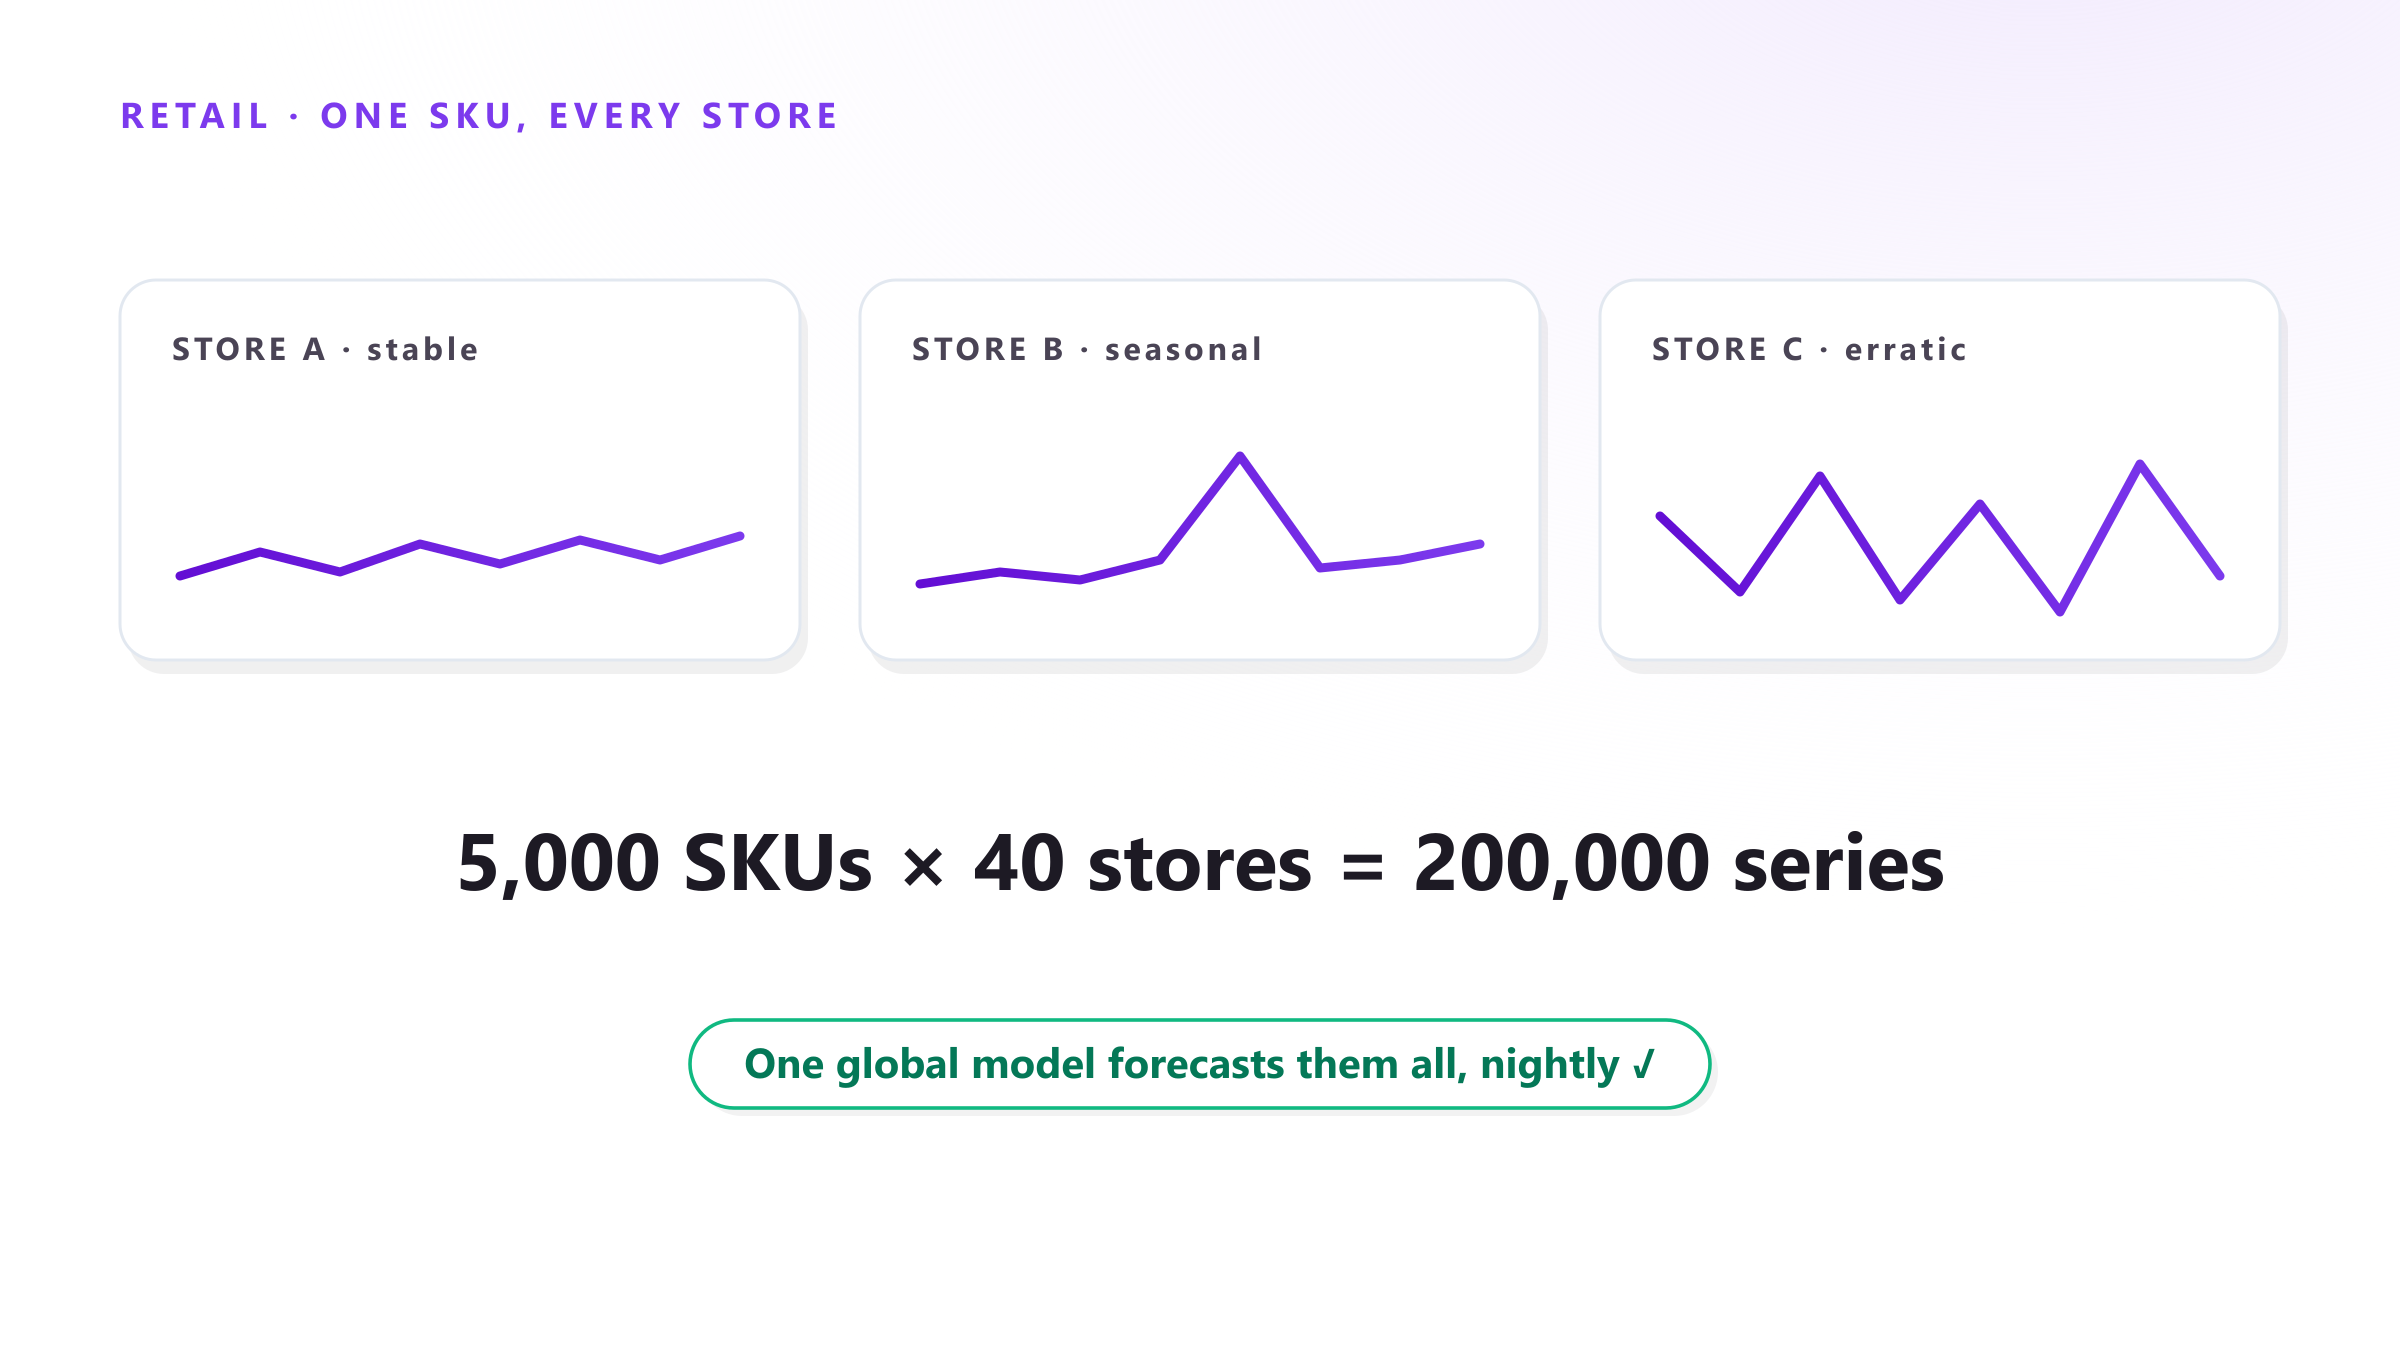
1. The granularity explodes. You don’t sell “snacks”; you sell SKU 4172, in store 38, on a Tuesday. A mid-size chain with 5,000 SKUs and 40 locations is forecasting 200,000 series — every one with its own seasonality, trend and noise. No spreadsheet survives that; we did the arithmetic in our Excel tutorial.
2. Promotions move a third of their own volume around. Promotional spikes look like growth, but Van Heerde, Leeflang & Wittink showed that a large share of the promotional bump — on the order of one third — is displaced demand: sales borrowed from the weeks before and after. Forecast the spike but miss the dip, and you’ll overstock twice a year — El Buen Fin in Mexico is the textbook case.
3. Exogenous variables run the show. Weather sells beer and umbrellas; payday weeks move baskets; holidays reshuffle whole categories. These are exactly the signals that won the M5 competition — run on real Walmart store-SKU data — where every top-50 method was Machine Learning and the winner beat the best classical benchmark by 22.4%.
4. The long tail is long. A few hundred SKUs drive most revenue; thousands of others sell sporadically. Treating them the same wastes planner hours where they don’t pay — the case for ABC/XYZ segmentation.
What forecast errors cost on the shelf
- Stockouts: Corsten & Gruen’s classic HBR study found shoppers face out-of-stocks on roughly 1 in 12 items, and retailers lose about 4% of sales to them — with nearly half of disappointed shoppers buying elsewhere or not at all.
- Overstock: unsold inventory becomes markdowns and write-offs. Walmart’s 2022 quarter with +32% inventory — and the markdowns that followed — made the cost visible at national scale (one of the five forecasting failures we documented).
- The compounding effect: an error at the store level travels upstream — wrong store orders → wrong DC replenishment → wrong purchase orders. Forecast error is the interest rate your whole supply chain pays.
What a modern retail forecasting setup looks like
The research and the practice converge on the same checklist:
- Forecast at the level you act on — SKU × location, daily or weekly, then aggregate for planning. Not the other way around.
- Feed the model the real demand drivers: promotions calendar, prices, weather, holidays and events as exogenous variables, not as manual overrides.
- Let one global model handle the catalog. Modern ML learns patterns across products — so even the long tail and new items get usable forecasts, instead of the linear fallback Excel gives them.
- Refresh daily. Retail demand shifts week to week; a forecast updated monthly is a photograph of last month.
- Segment your attention with ABC/XYZ: tight service levels and review on A-items, automation on the tail.
- Measure with volume-weighted metrics — WMAPE, not plain MAPE — so the long tail doesn’t distort the picture, and track bias so you catch systematic over-buying early.
McKinsey puts numbers on the payoff: AI-driven forecasting cuts errors by 20–50%, lost sales from unavailability by up to 65%, and warehousing costs by 5–10%.
Where Forecast Studio fits
This checklist is what Forecast Studio was built to do for retailers and distributors in Mexico and Latin America: one Machine Learning engine that forecasts thousands of SKU × store series nightly, ingests unlimited exogenous variables (weather, prices, promotions, events like El Buen Fin), and turns the forecast into inventory and purchasing decisions — safety stock, reorder points, order priorities — with up to 95% accuracy, no code, and no data-science team on your payroll.
Retail forecasting is hard. That’s exactly why fixing it is worth so much. Book a free 30-minute demo with your own sales history — we’ll show you what your shelves have been trying to tell you.
Sources: IHL Group, inventory distortion study · Fildes, Ma & Kolassa, Retail forecasting: Research and practice, IJF · Van Heerde, Leeflang & Wittink, The Estimation of Pre- and Postpromotion Dips, JMR · Makridakis et al., M5 accuracy competition, IJF · Corsten & Gruen, Stock-Outs Cause Walkouts, HBR · McKinsey, AI-driven operations forecasting